The Battle of the Cities – Great Vancouver, Canada
Introduction: Business Problem
In this project, we will try to find an optimal location for a Korean restaurant in Greater Vancouver, British Columbia, Canada. Vancouver has located on the west coast of Canada and has the highest population density in Canada, with over 5,400 people per square kilometre which makes it the fifth-most densely populated city with over 250,000 residents in North America. The population of Vancouver and Greater Vancouver is about 2.5 million. Vancouver is one of the most ethnically and linguistically diverse cities in Canada. 52% of its residents are not native English speakers, 48.9% are native speakers of either English or French, and 50.6% of residents belong to visible minority groups. The Chinese are the largest visible ethnic group in the city(26.5%). Other significant Asian ethnic groups in Vancouver are South and West Asian (7.4%), Filipino (5.9%), Japanese (1.7%), Korean (1.5%), as well as sizeable communities of Vietnamese, Indonesians, and Cambodians.
Being a high populated and ethnically diversified city, Vancouver offers multicultural restaurants in many neighbourhoods. To reflect the high Asian population, you can easily find Asian restaurants in most of the neighbourhoods.
Since there are lots of restaurants in Vancouver we will try to select locations that are already crowded with existing Asian restaurants but not too many Korean restaurants in the neighbourhood.
This report will be targeted at any clients who are new to the city and have interests to set up a new Korean restaurant or any clients who already own a restaurant but search for a new optimal location.
We will use our data science technique to generate a few most promising neighbourhoods based on these criteria. The advantages of each area will then be clearly expressed so that the best possible final location can be chosen by stakeholders.
Data Understanding
Based on our Business problem, factors that will influence our decision are the number of existing Asian restaurants in the neighbourhood and distance to Korean restaurants in the neighbourhood, if any.
Greater Vancouver is divided by many sub-cities. There are near 9000 Asian restaurants in the greater Vancouver area. With Foursquare API’s restriction returning top 100, we will loop thru the below coordinates using Foursquare API to extract the full list of Asian restaurants.
- latitude : 49.00N ~ 49.36N
- longitude : -123.20W ~ -122.2W
- step : 0.02
Foursquare : Venues Data
Foursquare has venue data with categories and geo-locations for food and type of restaurants. Data can be searched by area and retrieved in GeoJSON format. The Foursquare data is crowdsourced, so accuracy is not guaranteed and may have duplicate entries for the same venue and incorrect category assignments.
https://api.foursquare.com/v2/venues/explore?
- categoryId = {“Asian Restaurant” : 4bf58dd8d48988d142941735}
- intent = {indicating your intent in performing the search : browse}
- sw = { limits results to the bounding box by south-west corner: 49.00, -123.18}
- ne = { limits results to the bounding box by north-east corner : 49.36, -122.2}
After the initial evaluation of results from Foursquare API before data cleaning, we have 42 different types and about 1100 Asian restaurants.
This is a sufficient number of restaurants to group compare restaurant density thru the greater Vancouver area.
In [1]:
# import necessary libraries

import numpy as np
import pandas as pd
import requests
#from geopy.geocoders import Nominatim
from pandas.io.json import json_normalize # transform JSON file into a pandas dataframe

from sklearn.cluster import KMeans
# Matplotlib and associated plotting modules
import matplotlib.cm as cm
import matplotlib.colors as colors
import matplotlib.pyplot as plt
In [2]:
from geopy.geocoders import Nominatim
In [3]:
import folium
Foursquare API: Foursquare has venue data with categories and geo-locations for food and type of restaurants. Data can be searched by area and retrieved in GeoJSON format
https://api.foursquare.com/v2/venues/explore?
- categoryId = {“Asian Restaurant” : 4bf58dd8d48988d142941735}
- intent = {indicating your intent in performing the search : browse}
- sw = { limits results to the bounding box by south-west corner: 49.00, -123.18}
- ne = { limits results to the bounding box by north-east corner : 49.36, -122.7}
Methodology & Analysis
- I have to figure out what Foursquare API option I use for this project. As Foursquare API limits the number of returning query 100 for the exploring option and 50 for the search option, I try with the explore option. After running a few initial Foursquare queries, my result sets are over 100 for each city and each runs. Then I discover that the bounding box option can be used to narrow down the search query if I select the smaller area. The bounding box is required to have two points, SW and NE, then it pulls the venue results within that boundary.
- As I am using the Foursquare API bounding box option, I need to figure out the correct coordinates that cover the full Greater Vancouver region. Since Greater Vancouver does not have defined coordinates, I had to go thru all the cities in the boundary to find the right coordinate using google map.
- After collecting the required data, I need to check for the duplicated entries.
- Foursquare data is crowded data so the venue categories are not very consistently populated. I have to merge, join, clean the data before using it.
- I have to search for some of the restaurant’s names to determine the correct category for ambiguous entries.
- I use the K-Means Clustering algorithm to cluster the restaurants by coordinates. K-Means algorithm is one of the most common cluster methods of unsupervised learning. Latitude and Longitude are used as features. First I find the optimal K with K-Means with elbow method.
- Finally, I focus on the most promising area where high populated with Asian restaurants but a lower number of Korean restaurants to meet my project’s requirement.
In [6]:
# function to call Foursquare API using bounding box options.

def foursquare(new_sw_latitude, new_sw_longitude, new_ne_latitude, new_ne_longitude):
# @hidden_cell
    CLIENT_ID = '' # your Foursquare ID
    CLIENT_SECRET = '' # your Foursquare Secret
    VERSION = '20180605' # Foursquare API version
    LIMIT = 100
    categoryId='4bf58dd8d48988d142941735' # Asian Restaurant
    sw_latitude = new_sw_latitude
    sw_longitude = new_sw_longitude
    ne_latitude = new_ne_latitude
    ne_longitude = new_ne_longitude
    intent='browse'

    url = 'https://api.foursquare.com/v2/venues/explore?client_id={}&client_secret={}&sw={},{}&ne={},{}&v={}&categoryId={}&intent={}&limit={}'.format(CLIENT_ID, CLIENT_SECRET, sw_latitude, sw_longitude, ne_latitude, ne_longitude, VERSION, categoryId, intent, LIMIT)

    results = requests.get(url).json()
    return results
In [7]:
# function to get the category type from GeoJson data.

def get_category_type(row):
    try:
        categories_list = row['categories']
    except:
        categories_list = row['venue.categories']

    if len(categories_list) == 0:
        return None
    else:
        return categories_list[0]['name']
Let’s clean the json and structure it into a pandas dataframe
In [8]:
def get_data_create_temp(results):
    try: # to check if JSON return the empty body
        venues = results['response']['groups'][0]['items']

        nearby_venues = json_normalize(venues) # flatten JSON
        filtered_columns = ['venue.name', 'venue.categories','venue.location.lat', 'venue.location.lng', 'venue.location.address', 'venue.location.city']

        nearby_venues =nearby_venues.loc[:, filtered_columns]

# filter the category for each row

        nearby_venues['venue.categories'] = nearby_venues.apply(get_category_type, axis=1)

# clean columns
        nearby_venues.columns = [col.split(".")[-1] for col in nearby_venues.columns]

        nearby_venues.head()
    except:
        nearby_venues = pd.DataFrame()

    if nearby_venues.shape[0] == 0:  # JSON returned the empty body, we will return None
        return None
    else :
        return nearby_venues
Now we need to retrieve the data calling Foursquare API using the bounding box option(coordination SW and NE per each query). The range of longitude is -123.20 ~ -122.20. The range of latitude is 49.00 ~ 49.36. This range should fully cover the coordination of the greater Vancouver. The below code is looping numerous times by reducing the longitude by 0.02.
In [9]:
count = 0
# The range I do search restaurants are
# latitude 49.00 - 49.36
# longitude -123.18 ~ -122.2
for x in np.arange(-123.20, -122.2, 0.02) : # this will run range of longitude / 0.02

#    print('count', count, 'x : ', x)
    if count == 0: # first time running.  Just assign SW coordinates
        sw_latitude = 49.00 # assign the most South coordinate
        sw_longitude = x # assing the South West coordinate
        count += 1
    elif count == 1: # second time running.  Now we can assign NE coordinates and call Foursquare API
        ne_latitude = 49.36 # assign the most North latitude.  This value will be changing
        ne_longitude = x # assing the most North East longitude.
        results = foursquare(sw_latitude, sw_longitude, ne_latitude, ne_longitude)
        temp_df = get_data_create_temp(results) # create a temp dataframe

        master_df = temp_df # create a master_df to holding all the coordinates
        count += 1
        prev_ne_longitude = ne_longitude # assign the current ne longitude to previous ne longitude
    else:
        sw_latitude = sw_latitude # assign the previous sw latitude to the current sw latitude
        sw_longitude = prev_ne_longitude # assign the previous ne longitude to the current ne longitude
        new_ne_latitude = ne_latitude # assign the previous ne latitude to the current ne latitude
        new_ne_longitude = x # assign a new ne longitude
        results = foursquare(sw_latitude, sw_longitude, new_ne_latitude, new_ne_longitude)
        temp_df = get_data_create_temp(results) # create a temp dataframe

        master_df = master_df.append(temp_df, ignore_index = True) # append the temp dataframe to the master dataframe
        count += 1
        prev_ne_longitude = new_ne_longitude # assign the current ne longitude to the previous ne logitude


master_df.shape
Out[9]:
(1101, 6)
In [10]:
# save to a csv file in case the API calling can be limited/restricted
master_df.to_csv(r'master_df.csv')
After calling the Foursquare to explore query and the data has saved to master_df.
We will see how many restaurants have been returned.
In [13]:
print('{} venues were returned by Foursquare.'.format(master_df.shape))
(1101, 6) venues were returned by Foursquare.
Data Cleaning
Now we have data stored in master_df, we will start wranggling.
- First, check the duplicated rows in case the API returned any.
- We will see how many different categories of restaurants in our data.
- We will merge some categories of restaurants where “Sushi Restaurant” to “Japanese Restaurant”
- If still too many categories, we will reduce to less than 10 categories.
In [15]:
# Check if there is any duplicated rows.

duplicate = master_df.duplicated()
duplicate[duplicate==True]
master_df.reset_index(drop=True, inplace=True)
In [17]:
# print number of restaurants and number of categories
print(master_df.shape)
print(len(master_df["categories"].value_counts()))
master_df.head()
(1101, 6)
43
Out[17]:
| name | categories | lat | lng | address | city | |
|---|---|---|---|---|---|---|
| 0 | Green Leaf | Sushi Restaurant | 49.264206 | -123.180101 | 3416 West Broadway | Vancouver |
| 1 | Ora Sushi | Sushi Restaurant | 49.125278 | -123.183891 | 3651 Moncton St | Richmond |
| 2 | Red Tuna | Japanese Restaurant | 49.234746 | -123.184952 | 3592 W 41st Ave | Vancouver |
| 3 | The Eatery | Japanese Restaurant | 49.264279 | -123.180756 | 3431 W Broadway | Vancouver |
| 4 | Rajio Japanese Public House | Japanese Restaurant | 49.263516 | -123.187086 | 3763 W 10th Ave | Vancouver |
It looks like 1101 restaurants and 43 types of restaurants are returned from Foursquare API. Let’s see how many restaurants under each category.
In [18]:
master_df["categories"].value_counts()
Out[18]:
Sushi Restaurant                 226
Chinese Restaurant               190
Japanese Restaurant              145
Vietnamese Restaurant            127
Asian Restaurant                 112
Korean Restaurant                 80
Thai Restaurant                   58
Noodle House                      26
Ramen Restaurant                  22
Malay Restaurant                  17
Dim Sum Restaurant                16
Taiwanese Restaurant              10
Cantonese Restaurant               9
Szechuan Restaurant                6
Shanghai Restaurant                5
Coffee Shop                        5
Filipino Restaurant                5
Vegetarian / Vegan Restaurant      4
Hotpot Restaurant                  4
Food Court                         4
Shabu-Shabu Restaurant             2
Seafood Restaurant                 2
Food Truck                         2
Bubble Tea Shop                    2
Bakery                             2
BBQ Joint                          2
Café                               2
Diner                              1
Dumpling Restaurant                1
Donut Shop                         1
Indian Chinese Restaurant          1
Fast Food Restaurant               1
Lounge                             1
Ice Cream Shop                     1
Taco Place                         1
Hot Dog Joint                      1
Tea Room                           1
Restaurant                         1
Middle Eastern Restaurant          1
Burger Joint                       1
Dessert Shop                       1
Japanese Curry Restaurant          1
Fried Chicken Joint                1
Name: categories, dtype: int64
It looks like we can merge some categores.
- “Sushi Restuarant”, “Ramen Restaurant”, “Japanese Curry Restaurant” and “Shabu-Shabu Restaurant” can merge into “Japanese Restaurant”
- “Shanghai Restaurant”, “Cantonese Restaurant”, “Dim Sum Restaurant”, “Szechuan Restaurant”, “Dumpling Restaurant”, “Indian Chinese Restaurant”, “Taiwanese Restaurant” merge into “Chinese Restaurant”
In [20]:
master_df['categories'].replace(to_replace=['Sushi Restaurant'],value=["Japanese Restaurant"],inplace=True)
In [21]:
master_df['categories'].replace(to_replace=['Ramen Restaurant'],value=["Japanese Restaurant"],inplace=True)
In [22]:
master_df['categories'].replace(to_replace=['Japanese Curry Restaurant'],value=["Japanese Restaurant"],inplace=True)
In [23]:
master_df['categories'].replace(to_replace=['Shabu-Shabu Restaurant'],value=["Japanese Restaurant"],inplace=True)
In [24]:
master_df['categories'].replace(to_replace=['Shanghai Restaurant'],value=["Chinese Restaurant"],inplace=True)
In [25]:
master_df['categories'].replace(to_replace=['Cantonese Restaurant'],value=["Chinese Restaurant"],inplace=True)
In [26]:
master_df['categories'].replace(to_replace=['Dim Sum Restaurant'],value=["Chinese Restaurant"],inplace=True)
In [27]:
master_df['categories'].replace(to_replace=['Szechuan Restaurant'],value=["Chinese Restaurant"],inplace=True)
In [28]:
master_df['categories'].replace(to_replace=['Dumpling Restaurant'],value=["Chinese Restaurant"],inplace=True)
In [29]:
master_df['categories'].replace(to_replace=['Indian Chinese Restaurant'],value=["Chinese Restaurant"],inplace=True)
In [30]:
master_df['categories'].replace(to_replace=['Taiwanese Restaurant'],value=["Chinese Restaurant"],inplace=True)
In [31]:
print(len(master_df["categories"].value_counts()))
master_df["categories"].value_counts()
32
Out[31]:
Japanese Restaurant              396
Chinese Restaurant               238
Vietnamese Restaurant            127
Asian Restaurant                 112
Korean Restaurant                 80
Thai Restaurant                   58
Noodle House                      26
Malay Restaurant                  17
Coffee Shop                        5
Filipino Restaurant                5
Vegetarian / Vegan Restaurant      4
Food Court                         4
Hotpot Restaurant                  4
BBQ Joint                          2
Café                               2
Bakery                             2
Bubble Tea Shop                    2
Seafood Restaurant                 2
Food Truck                         2
Diner                              1
Fast Food Restaurant               1
Donut Shop                         1
Lounge                             1
Ice Cream Shop                     1
Taco Place                         1
Fried Chicken Joint                1
Tea Room                           1
Restaurant                         1
Middle Eastern Restaurant          1
Burger Joint                       1
Dessert Shop                       1
Hot Dog Joint                      1
Name: categories, dtype: int64
We still have 32 categories. Let’s create a new dataframe for top 8 categories.
In [32]:
new_df = master_df[master_df['categories'].str.contains('Chinese', regex=False)]
new_df = new_df.append(master_df[master_df['categories'].str.contains('Korea', regex=False)])
new_df = new_df.append(master_df[master_df['categories'].str.contains('Japan', regex=False)])
new_df = new_df.append(master_df[master_df['categories'].str.contains('Vietnamese', regex=False)])
new_df = new_df.append(master_df[master_df['categories'].str.contains('Thai', regex=False)])
new_df = new_df.append(master_df[master_df['categories'].str.contains('Noodle', regex=False)])
new_df = new_df.append(master_df[master_df['categories'].str.contains('Malay', regex=False)])
new_df = new_df.append(master_df[master_df['categories'].str.contains('Asian', regex=False)])
new_df.reset_index(drop=True, inplace=True)
new_df.shape
Out[32]:
(1054, 6)
Notice categories “Asian Restaurant” has 112 and it is ambiguous. We will merge more for some obvious entries.
In [33]:
new_df[new_df['categories'].str.contains('Asian')]
Out[33]:
| name | categories | lat | lng | address | city | |
|---|---|---|---|---|---|---|
| 942 | Iron Wok | Asian Restaurant | 49.268295 | -123.186468 | #255 – 2083 Alma Street | Vancouver |
| 943 | G-Men Ramen (Steveston) | Asian Restaurant | 49.124406 | -123.184630 | 3711 Bayview Street | Richmond |
| 944 | Taste of Thai | Asian Restaurant | 49.264362 | -123.184758 | 3629 W Broadway | Vancouver |
| 945 | Rice Tales | Asian Restaurant | 49.195574 | -123.184180 | Vancouver International Airport (YVR) | Richmond |
| 946 | Strike | Asian Restaurant | 49.264298 | -123.176555 | 3217 West Broadway | Vancouver |
| … | … | … | … | … | … | … |
| 1049 | Lotus Garden Express | Asian Restaurant | 49.103670 | -122.492202 | 26426 56 Ave | Township of Langley |
| 1050 | Wok Box | Asian Restaurant | 49.050430 | -122.325552 | 32500 S Fraser Way | Abbotsford |
| 1051 | Noodle Road | Asian Restaurant | 49.044716 | -122.338340 | #24 31940 south fraser way | Abbotsford |
| 1052 | Thai Express | Asian Restaurant | 49.049673 | -122.312753 | 32900 South Fraser Way,Sevenoaks Shopping Centre | Abbotsford |
| 1053 | Noodlebox | Asian Restaurant | 49.046552 | -122.287165 | 2455 West Railway Street | Abbotsford |
112 rows × 6 columnsIn [34]:
new_df.loc[new_df['categories'].str.contains('Asian') & new_df['name'].str.contains('Chinese'), 'categories'] = 'Chinese Restaurant'
In [35]:
new_df.loc[new_df['categories'].str.contains('Asian') & new_df['name'].str.contains('China'), 'categories'] = 'Chinese Restaurant'
In [36]:
new_df.loc[new_df['categories'].str.contains('Asian') & new_df['name'].str.contains('Wok'), 'categories'] = 'Chinese Restaurant'
In [37]:
new_df.loc[new_df['categories'].str.contains('Asian') & new_df['name'].str.contains('Japan'), 'categories'] = 'Japanese Restaurant'
In [38]:
new_df.loc[new_df['categories'].str.contains('Asian') & new_df['name'].str.contains('Banana Leaf'), 'categories'] = 'Malay Restaurant'
In [39]:
new_df.loc[new_df['categories'].str.contains('Asian') & new_df['name'].str.contains('Sushi'), 'categories'] = 'Japanese Restaurant'
In [40]:
new_df.loc[new_df['categories'].str.contains('Asian') & new_df['name'].str.contains('Ramen'), 'categories'] = 'Japanese Restaurant'
In [41]:
new_df.loc[new_df['categories'].str.contains('Asian') & new_df['name'].str.contains('Szechuan'), 'categories'] = 'Chinese Restaurant'
In [42]:
new_df.loc[new_df['categories'].str.contains('Asian') & new_df['name'].str.contains('Pearl'), 'categories'] = 'Chinese Restaurant'
In [43]:
new_df.loc[new_df['categories'].str.contains('Asian') & new_df['name'].str.contains('Palace'), 'categories'] = 'Chinese Restaurant'
In [44]:
new_df.loc[new_df['categories'].str.contains('Asian') & new_df['name'].str.contains('Dynasty'), 'categories'] = 'Chinese Restaurant'
In [45]:
new_df[new_df['categories'].str.contains('Asian')]
Out[45]:
| name | categories | lat | lng | address | city | |
|---|---|---|---|---|---|---|
| 944 | Taste of Thai | Asian Restaurant | 49.264362 | -123.184758 | 3629 W Broadway | Vancouver |
| 945 | Rice Tales | Asian Restaurant | 49.195574 | -123.184180 | Vancouver International Airport (YVR) | Richmond |
| 946 | Strike | Asian Restaurant | 49.264298 | -123.176555 | 3217 West Broadway | Vancouver |
| 949 | MAK N MING | Asian Restaurant | 49.271230 | -123.155032 | 1629 Yew Street | Vancouver |
| 950 | Noodlebox | Asian Restaurant | 49.268096 | -123.147275 | 1867 West 4th Avenue | Vancouver |
| … | … | … | … | … | … | … |
| 1045 | Ban Chok Dee | Asian Restaurant | 49.103026 | -122.652841 | 20563 Douglas Crescent | Township of Langley |
| 1049 | Lotus Garden Express | Asian Restaurant | 49.103670 | -122.492202 | 26426 56 Ave | Township of Langley |
| 1051 | Noodle Road | Asian Restaurant | 49.044716 | -122.338340 | #24 31940 south fraser way | Abbotsford |
| 1052 | Thai Express | Asian Restaurant | 49.049673 | -122.312753 | 32900 South Fraser Way,Sevenoaks Shopping Centre | Abbotsford |
| 1053 | Noodlebox | Asian Restaurant | 49.046552 | -122.287165 | 2455 West Railway Street | Abbotsford |
83 rows × 6 columns
In [46]:
new_df.shape[0]
Out[46]:
1054
Let’s see the percentage
In [47]:
percentage_korean_rest =(new_df.categories[new_df['categories']=='Korean Restaurant'].count()/new_df.shape[0]) * 100


print('the percetage of Korean Restaurants in Greater Vancouver is {:.2f}'.format(percentage_korean_rest))
the percetage of Korean Restaurants in Greater Vancouver is 7.59
Now we want to cluster the restaurants. I use the K-Means Clustering algorithm to cluster the restaurants. K-Means algorithm is one of the most common cluster methods of unsupervised learning. Latitude and Longitude will be used as the features. First I want to find the optimal K with K-Means with elbow method.
In [48]:
# create a new dataframe just for lat and lng.  This dataframe will be used for K-Means algorithm.
van_geodata = new_df[["lat","lng"]]
K-Means with elbow method.
Run K-means with elbow method to find an optimal K
In [49]:
# run K-means with k = 1 ~ 15.
sum_of_squared_distances = []
kclusters = range(1, 15)
for k in kclusters:
    kmeans = KMeans(n_clusters = k, random_state=0).fit(van_geodata)
    kmeans.labels_
    sum_of_squared_distances.append(kmeans.inertia_)
In [50]:
plt.plot(kclusters, sum_of_squared_distances,'bx-')
plt.xlabel('k')
plt.ylabel('sum_of_squared_distances')
plt.title('Elbow Mehtod for Optimal k')
plt.show()

It looks like 6 is the optimal K per elbow method.
K-Means Clustering Algorithm with K = 6
In [51]:
kclusters = 6
kmeans = KMeans(n_clusters = kclusters, random_state=0).fit(van_geodata)
In [52]:
kmeans.labels_
Out[52]:
array([1, 1, 1, ..., 3, 3, 3], dtype=int32)
In [53]:
centeroid = kmeans.cluster_centers_ # find the centroid of 6 clusters
In [54]:
centeroid
Out[54]:
array([[  49.23579085, -122.84510946],
       [  49.24828937, -123.12938478],
       [  49.15462665, -122.65233233],
       [  49.05885618, -122.3257686 ],
       [  49.24336299, -123.01302586],
       [  49.10127885, -122.81590928]])
Google Maps API reverse geocoding
After finding the centre of each cluster, the city name will be obtained using the coordinates of the centre points. city_df dataframe is populated with city name.
In [55]:
locator = Nominatim(user_agent = "myGeocoder")
#coordinates = "49.26208669, -123.14957017"
city = []
for i in range(len(centeroid)):
    coordinates = centeroid[i]

    location = locator.reverse(coordinates)
    coord = location.raw
    address = coord['address']
    city.append(address['city'])
 #   city_df['Cluster Labels'] = i
city_df = pd.DataFrame(city)
In [56]:
city_df["Cluster Labels"] = city_df.index # add Cluster labels
In [57]:
city_df.rename(columns={0:'city_name'}, inplace=True) # Rename first column to be city_name
In [58]:
city_df[['latitude', 'longitude']] = pd.DataFrame(centeroid, index=city_df.index) # add coordinates of each centroid to the dataframe
In [59]:
city_df
Out[59]:
| city_name | Cluster Labels | latitude | longitude | |
|---|---|---|---|---|
| 0 | Coquitlam | 0 | 49.235791 | -122.845109 |
| 1 | Vancouver | 1 | 49.248289 | -123.129385 |
| 2 | Township of Langley | 2 | 49.154627 | -122.652332 |
| 3 | Abbotsford | 3 | 49.058856 | -122.325769 |
| 4 | Burnaby | 4 | 49.243363 | -123.013026 |
| 5 | Surrey | 5 | 49.101279 | -122.815909 |
In [61]:
new_df.insert(0, 'Cluster Labels', kmeans.labels_) # add Cluser Labels to the restaurant dataframe
In [62]:
new = city_df.merge(new_df, on=['Cluster Labels']) # Merge two dataframes on Cluster Labels.
We have merged two dataframes into one.
This contains
- cluster city name,
- coordinate of centeroid for each clusters
- name of the restaurant
- category of the restaurant
- coordinates of the restaurant
- address of the restaurant
- city name of the restaurant
In [63]:
new.head()
Out[63]:
| city_name | Cluster Labels | latitude | longitude | name | categories | lat | lng | address | city | |
|---|---|---|---|---|---|---|---|---|---|---|
| 0 | Coquitlam | 0 | 49.235791 | -122.845109 | New West Wonton House | Chinese Restaurant | 49.205498 | -122.928983 | 441 – 12th street | New Westminster |
| 1 | Coquitlam | 0 | 49.235791 | -122.845109 | New Lakeview Restaurant | Chinese Restaurant | 49.220520 | -122.929862 | 7763 6th street | New Westminster |
| 2 | Coquitlam | 0 | 49.235791 | -122.845109 | North Noodle House | Chinese Restaurant | 49.201135 | -122.913047 | 356 – 800 Carnarvon St | New Westminster |
| 3 | Coquitlam | 0 | 49.235791 | -122.845109 | Hon’s Wun-Tun House | Chinese Restaurant | 49.210435 | -122.917081 | 408 – 6th Street | New Westminster |
| 4 | Coquitlam | 0 | 49.235791 | -122.845109 | Wild Rice | Chinese Restaurant | 49.200105 | -122.911185 | 810 Quayside Dr | New Westminster |
This shows how many restaurants under each clusters.
In [64]:
new['city_name'].value_counts()
Out[64]:
Vancouver              338
Coquitlam              265
Burnaby                265
Township of Langley     80
Surrey                  70
Abbotsford              36
Name: city_name, dtype: int64
New datafram is created for the plotting. We want to group them by city and categories
In [65]:
tmp_df = new[['city_name', 'categories']]
tmp_df.shape
Out[65]:
(1054, 2)
In [66]:
fig, ax = plt.subplots(figsize= (20, 10))
tmp_df.groupby(['city_name'])['categories'].value_counts().unstack().plot(kind='bar', ax=ax)
Out[66]:
<matplotlib.axes._subplots.AxesSubplot at 0x1a1d82d950>

From the plot, Vancouver cluster has the most restaurants and not too many Korean restaurants. This cluster may be a good candidate for our goal.
In [67]:
tmp_df.groupby(['city_name'])['categories'].value_counts()
Out[67]:
city_name            categories
Abbotsford           Japanese Restaurant       18
                     Chinese Restaurant         9
                     Asian Restaurant           3
                     Vietnamese Restaurant      3
                     Thai Restaurant            2
                     Noodle House               1
Burnaby              Chinese Restaurant        95
                     Japanese Restaurant       76
                     Vietnamese Restaurant     38
                     Asian Restaurant          26
                     Korean Restaurant         14
                     Thai Restaurant           10
                     Malay Restaurant           3
                     Noodle House               3
Coquitlam            Japanese Restaurant       90
                     Chinese Restaurant        51
                     Korean Restaurant         48
                     Vietnamese Restaurant     32
                     Asian Restaurant          20
                     Thai Restaurant           19
                     Malay Restaurant           3
                     Noodle House               2
Surrey               Japanese Restaurant       37
                     Chinese Restaurant        14
                     Vietnamese Restaurant      9
                     Thai Restaurant            4
                     Asian Restaurant           3
                     Korean Restaurant          2
                     Noodle House               1
Township of Langley  Japanese Restaurant       44
                     Chinese Restaurant        15
                     Vietnamese Restaurant      9
                     Thai Restaurant            5
                     Asian Restaurant           4
                     Korean Restaurant          2
                     Noodle House               1
Vancouver            Japanese Restaurant      141
                     Chinese Restaurant        72
                     Vietnamese Restaurant     36
                     Asian Restaurant          27
                     Noodle House              18
                     Thai Restaurant           18
                     Korean Restaurant         14
                     Malay Restaurant          12
Name: categories, dtype: int64
Let’s explore more with the top 2 categories and Korean restaurant to confirm our assumption. Only pull Chinese, Japanese, and Korean for the categories.
In [68]:
chin_jap_korea = tmp_df[tmp_df['categories'].str.contains('Chinese', regex=False)]
chin_jap_korea = chin_jap_korea.append(tmp_df[tmp_df['categories'].str.contains('Korea', regex=False)])
chin_jap_korea = chin_jap_korea.append(tmp_df[tmp_df['categories'].str.contains('Japan', regex=False)])

chin_jap_korea.shape
Out[68]:
(742, 2)
There are 742 restaurants for Chinese, Japanese, and Korean Restaurant categories. Let’s plot them to see if we get the same result.
In [69]:
fig, ax = plt.subplots(figsize= (15, 7))
chin_jap_korea.groupby(['city_name'])['categories'].value_counts().unstack().plot(kind='bar', ax=ax)
Out[69]:
<matplotlib.axes._subplots.AxesSubplot at 0x1a1d7f7350>
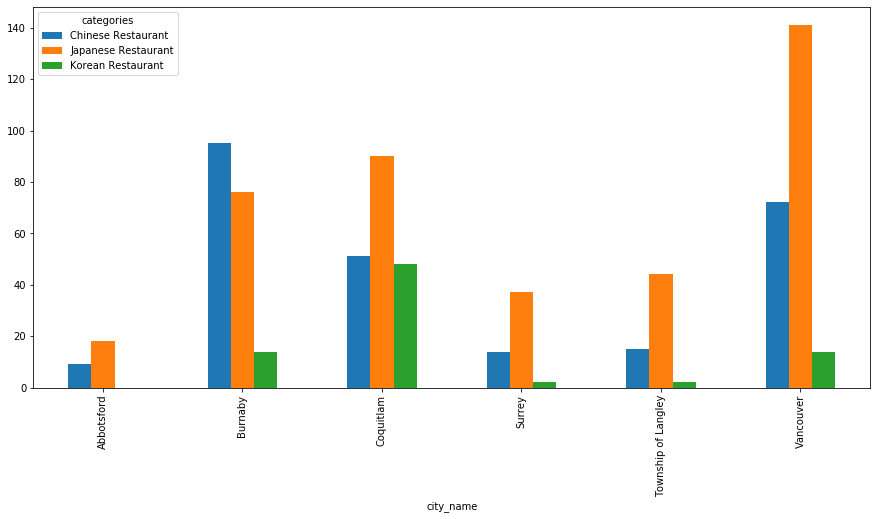
From the plotting, we see the same result. Vancouver has the most restaurants and less Korean restaurants.
In [70]:
chin_jap_korea.groupby(['city_name'])['categories'].value_counts()
Out[70]:
city_name            categories
Abbotsford           Japanese Restaurant     18
                     Chinese Restaurant       9
Burnaby              Chinese Restaurant      95
                     Japanese Restaurant     76
                     Korean Restaurant       14
Coquitlam            Japanese Restaurant     90
                     Chinese Restaurant      51
                     Korean Restaurant       48
Surrey               Japanese Restaurant     37
                     Chinese Restaurant      14
                     Korean Restaurant        2
Township of Langley  Japanese Restaurant     44
                     Chinese Restaurant      15
                     Korean Restaurant        2
Vancouver            Japanese Restaurant    141
                     Chinese Restaurant      72
                     Korean Restaurant       14
Name: categories, dtype: int64
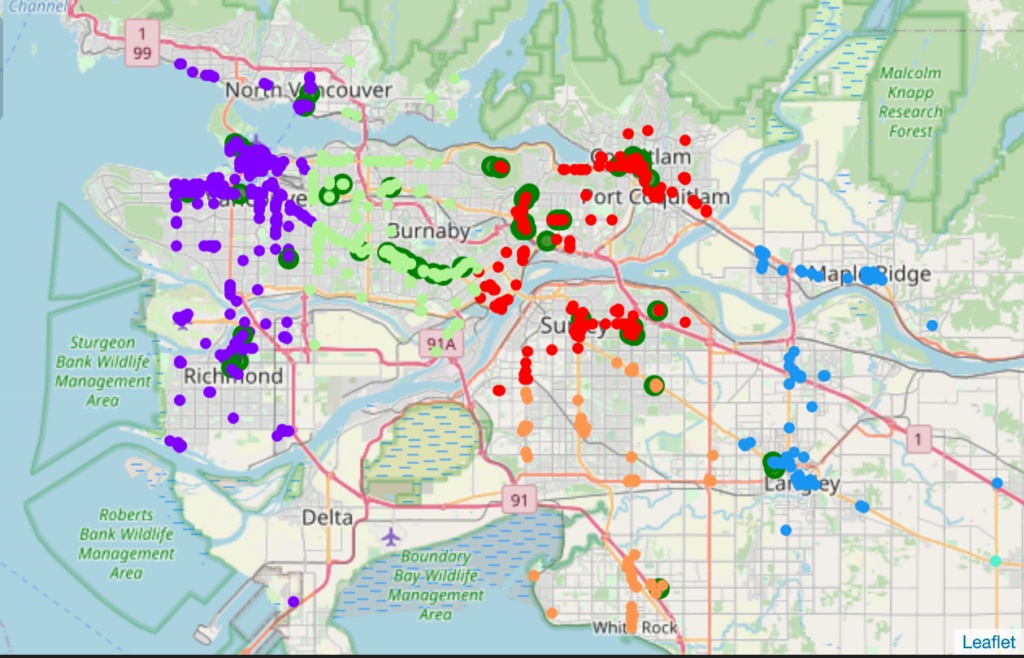
You can see the clustered map of Vancouver below. Each cluster show in a different colour. Korean Restaurant is showing in green marker.
In [72]:
# create map
latitude = 49.18
longitude = -122.80
map_clusters = folium.Map(location=[latitude, longitude], zoom_start=10)

# set color scheme for the clusters
x = np.arange(kclusters)
ys = [i + x + (i*x)**2 for i in range(kclusters)]
colors_array = cm.rainbow(np.linspace(0, 1, len(ys)))
rainbow = [colors.rgb2hex(i) for i in colors_array]

# add markers to the map
markers_colors = []
for lat, lon, cat, name, cluster in zip(new['lat'], new['lng'], new['categories'], new['city_name'], new['Cluster Labels']):
    label = folium.Popup(str(cat) + ': city ' + str(name), parse_html=True)
    if cat == "Korean Restaurant": r = 5
    else: r = 2
    folium.features.CircleMarker(
        [lat, lon],
        radius= r,
        popup=label,
        color='green' if cat == "Korean Restaurant" else rainbow[cluster-1],
        fill=True,
        fill_color="green" if cat == "Korean Restaurant" else rainbow[cluster-1],
        fill_opacity=0.7
    ).add_to(map_clusters)

map_clusters
Out[72]:
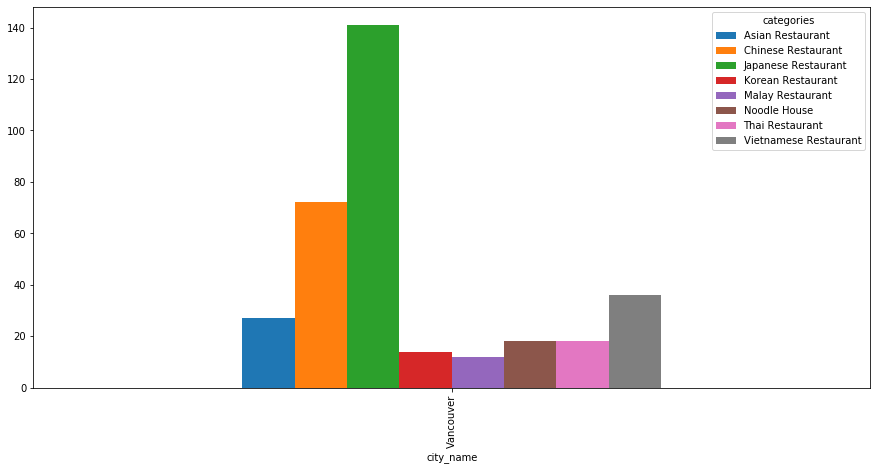
Now we will explore more for the Vancouver cluster. It has 338 restaurants. Let’s see the distribution of the restaurant in the Vancouver cluster
In [73]:
candidate_df = new[new['city_name'] == 'Vancouver']
candidate_df.shape
Out[73]:
(338, 10)
In [74]:
candidate_df.reset_index(drop=True, inplace=True)
candidate_df.head()
Out[74]:
| city_name | Cluster Labels | latitude | longitude | name | categories | lat | lng | address | city | |
|---|---|---|---|---|---|---|---|---|---|---|
| 0 | Vancouver | 1 | 49.248289 | -123.129385 | Timmy Kitchen | Chinese Restaurant | 49.124282 | -123.183319 | 100-3791 Bayview Street | Richmond |
| 1 | Vancouver | 1 | 49.248289 | -123.129385 | Imperial City Bistro | Chinese Restaurant | 49.170016 | -123.182943 | 140 – 3671 Westminster Hwy | Richmond |
| 2 | Vancouver | 1 | 49.248289 | -123.129385 | Wok n’ Roll | Chinese Restaurant | 49.193673 | -123.181371 | YVR Airport | Richmond |
| 3 | Vancouver | 1 | 49.248289 | -123.129385 | Simon’s Kitchen | Chinese Restaurant | 49.246982 | -123.185160 | 4418 Dunbar | Vancouver |
| 4 | Vancouver | 1 | 49.248289 | -123.129385 | Lok’s Chinese Restaurant | Chinese Restaurant | 49.234686 | -123.161839 | 2436 West 41st Avenue | Vancouver |
In [75]:
fig, ax = plt.subplots(figsize= (15, 7))
candidate_df.groupby(['city_name'])['categories'].value_counts().unstack().plot(kind='bar', ax=ax)
Out[75]:
<matplotlib.axes._subplots.AxesSubplot at 0x1a1d847450>
In [76]:
candidate_df['categories'].value_counts()
Out[76]:
Japanese Restaurant      141
Chinese Restaurant        72
Vietnamese Restaurant     36
Asian Restaurant          27
Noodle House              18
Thai Restaurant           18
Korean Restaurant         14
Malay Restaurant          12
Name: categories, dtype: int64
In [77]:
percentage_korean_rest =(candidate_df.categories[candidate_df['categories']=='Korean Restaurant'].count()/candidate_df.shape[0]) * 100


print('the percetage of Korean Restaurants in Vancouver cluster is {:.2f}'.format(percentage_korean_rest))
the percetage of Korean Restaurants in Vancouver cluster is 4.14
The percentage of Korean restaurants in greater Vancouver was 7.59%.
The percentage of the Korean Restaurant in Vancouver Cluster is definitely 4.14%
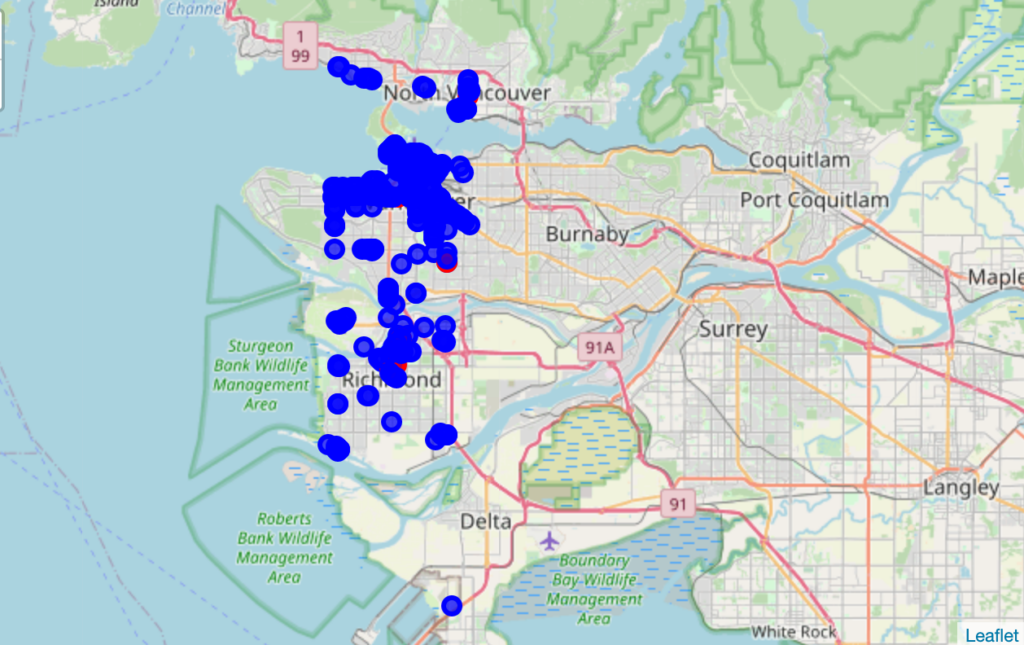
Finally plot the restaurant in the Vancouver cluster.
In [83]:
# create map
latitude = candidate_df.iloc[0].latitude
longitude = candidate_df.iloc[0].longitude
map_candidate = folium.Map(location=[latitude, longitude], zoom_start=11)

# set color scheme for the clusters
#x = np.arange(kclusters)
#ys = [i + x + (i*x)**2 for i in range(kclusters)]
#colors_array = cm.rainbow(np.linspace(0, 1, len(ys)))
#rainbow = [colors.rgb2hex(i) for i in colors_array]

# add markers to the map
markers_colors = []
for lat, lon, cat, name, cluster in zip(candidate_df['lat'], candidate_df['lng'], candidate_df['categories'], candidate_df['city_name'], new['Cluster Labels']):
    label = folium.Popup(str(cat) + ': city ' + str(name), parse_html=True)
    folium.CircleMarker(
        [lat, lon],
        radius=5,
        popup=label,
        color='red' if cat == "Korean Restaurant" else 'blue',
        fill=True,
#        fill_color=rainbow[cluster-1],
        fill_opacity=0.7).add_to(map_candidate)

map_candidate
Out[83]:
Result & Discussion
- It’s worth noting that Foursquare API only returned 25 Korean restaurants without specifying “intent=browse”. The default is “intent=checkin” which does not return restaurants if you are outside of Foursquare defined check-in area
- This analysis shows that although there are over 1000 Asian restaurants in the Greater Vancouver area, Vancouver city offers the best location for the new Korean restaurant venue. Burnaby and Coquitlam show a very similar number of total Asian restaurants but Coquitlam has 3.4 times more Korean restaurants than Burnaby.
- I used the K-Means algorithm as part of this cluster studying. When I tested the K-Means with the Elbow method, the optimal K can be 6 to 10. After I tested with different values, the results were not too different. Therefore I selected 6 as my optimal K.
- I ended up the study by visualizing the Vancouver clustering information on the Greater Vancouver map. For the future study, the distance between Korean restaurants/Asian restaurants can be calculated and considered as another feature
Conclusion
- The purpose of this project was to identify an optimal city/neighbourhood in the Greater Vancouver region for a new Korean restaurant. By calculating restaurant density distribution from Foursquare data, we narrowed down the candidates into 6 cities. Then the further study of the clustering data, we selected the final location. The final decision on optimal restaurant location will be made by stakeholders based on specific characteristics of neighbourhoods and locations in every recommended zone, taking into consideration additional factors like the attractiveness of each location (proximity to park or water), levels of noise/proximity to major roads, real estate availability, prices, social and economic dynamics of every neighbourhood etc.