Eric Kuck, AI and Data Science Architect March 16, 2020
This month, I am finishing my IBM Data Science series on Coursera, and had to do a final project called a capstone that showcases the skills taught throughout the course series. I’ll share a bit of what I submitted, but more importantly, let’s see how I chose my project.
The lead-in project for the capstone showed how to plot data from Foursquare using Folium maps. It was suggested we call our individual follow-on project ‘The Battle of the Neighbourhoods’, and use Foursquare data, but we were also encouraged to explore other data sets and be inventive. Oh Yeah!
The course instructor is Alex Aklson from IBM in Toronto. I happen to also have worked at IBM for 17 years in the US before moving up to Canada, so I definitely enjoyed the Canada view of data science and little touches like mapping Toronto ‘neighbourhoods’. I can’t tell you how many errors I had in my notebook though from continuously mixing my American ‘neighborhood’ spelling with the Canadian ‘neighbourhood’. I’m now a dual citizen, and unfortunately, that seems to include being a dual speller. Anyway, The Foursquare idea was a bit basic, so I started to explore open data sets to see what was available…
My new home city of Vancouver definitely came to the resume here because I soon found the Vancouver Open Data Portal ( https://opendata.vancouver.ca/pages/home/ ) and started browsing the datasets, preferably something that had geographic coordinates. I soon found the Vancouver Tree dataset, which has a stunning 146,221 trees in the database, with geo coordinates, size, street address, and genus/species data. Zooming down to those streets around my condo with the online map browser showed a few Elm trees nearby. I grew up in the country in Ohio, and we had a single huge elm that escaped the great die-off in the 1960s when Dutch Elm Disease swept thru North America. So, I had the start of an idea. Plot the elms, cluster them and see if they are grouped in certain areas of the city.
The next step was looking up Elm and Dutch Elm Disease on Wikipedia to find details for my intro section. While reading the Elm (Ulmus) entry on Wikipedia, I noticed this graph:

I see Ulmus (Elm) at the bottom is part of the Ulmaceae family, but somethings interesting about the outgroup name. Cannabaceae… could that possibly be … Cannabis?
Yes! It is! I also remembered a big stock plunge of several Canadian Cannabis companies last year when their inventory had mold and fungus. Hmmm. Isn’t Dutch Elm disease also a fungus? Yes, it is!
Now suddenly I had the spark to integrate the Foursquare data into the project. I could map the trees and all the new Cannabis dispensaries that opened up last year, and add a hypothetical concern from the city that they are worried fungus from the dispensaries could kick off a dutch elm epidemic. I mean, cross-species disease jumps are a huge concern now, and Ulmus-Cannabis looks closer than Bat-Human. I also decided to toss in the lumberyards and other wood related locations just to round things out. The Elm trees in Western Canada have apparently been protected because we have a colder climate than the US and Eastern Canada, but that’s changing with global warming. Wow, Foursquare data, mapping, a great open dataset, a personal backstory, a cross-species disease jump, and global warming. Well, that’s certainly a project I am interested in doing!
The rest is just copy-paste of old code, customizations, lots of google searches, and reading of online documentation. Rather boring. I discovered along the way that my precious, perfect open data trees dataset actually didn’t have geo-coordinates for 231 elm trees (Queue the J. Giles song in my head…) so I also added in the Google Geocode API to do a reverse lookup on the geo-coordinates from the tree address. BTW, Did you know google thinks addresses aren’t on the street but at the building? The new geo coordinates plot the trees in the centre of the building, but that’s ok for a course project.
So that’s how I decided on my project. I intentionally waited several days as I looked thru the datasets before jumping into code. This helped me keep the bigger picture in mind, or as they say…. Oh please don’t…. The forest from the trees.
Here’s a bit of the report below.
Vancouver Elm Trees – Geographic Clustering and Disease Risk
(or… Can pot kill a tree?)

Could cannabis fungus move to trees and cause Dutch Elm disease?
Introduction and Business Understanding
Vancouver city is concerned that the 2,863 elm trees planted throughout the city may be at risk of a deadly disease spread by similar plants in the Ulmaceae/Cannabaceae family.
Note: The City of Vancouver has not actually requested any data regarding dutch elm disease.
Cannabaceae is closely related to the Elm tree (Ulmus).
Both are susceptible to fungal infections.
Source: https://en.wikipedia.org/wiki/Ulmaceae
- Dutch Elm Disease (DED) killed 25 million elms in Britain alone, before spreading to North America in imported logs. The fungal disease changed the city landscapes, as many 50+ year old trees up to a meter across previously lined the streets. The cost to remove dead trees and replant was extremely expensive. The disease is caused by a fungus that is transmitted by air and also by bark beetles.
- A similar beetle infestation has decimated 18 million hectares of BC forests, leaving millions of dead trees that increase the severity of forest fires. Though not related to elms, this has sensitized western Canada to the loss of trees.
- Canada has recently legalized a related plant to the elm family called cannabis. Vancouver has licensed many new marijuana/cannabis dispensaries in 2019.
- Cannabis companies are having growing pains, with some forced to destroy crops due to fungal infections. In 2019 one company alone destroyed $77 million of product due to Health Canada violations.
- Canada currently has fines up to $50,000 for moving firewood between regions to stop the transmission of dutch elm, beetles, and other tree diseases.
- The value of the 700,000 elm trees in Canada was estimated at $2.5 billion dollars in 1999. The tree value and removal cost for a lost tree can be $10k per tree, making the exposure to the city approximately $28 million dollars.
The city planners would like to know the impact if fungus from cannabis infected the elm trees, as they are related species, and similar jumps (Corona bat-human) have recently saturated the news.
Specifically:
- What is the breakdown of elm trees by neighbourhood?
- Where are the larger groups of elm trees in Vancouver?
- Where are the new cannabis dispensaries located?
- Are any dispensaries located near groups of elm trees?
- Are any tree nurseries or lumberyards close to elm trees?
- Are any campgrounds or RV parks close to elm trees?
- Are the groups isolated in case an infection does start?
- Are there individual outlier trees that could become bridges between groups if infection occurs?
The city is primarily focused on infection from cannabis species jump, but they would also like nurseries, campgrounds, lumberyards, and RV parks included in case dutch elm is accidentally brought in via infected wood.
Unlike eastern Canada, Elms in western Canada have not historically had dutch elm disease because they were planted outside their normal climactic range. A hotter climate in BC from global warming could put western Canada elms at risk.
Data Understanding
Vancouver city has recently invested in an Open Data Portal (opendata.vancouver.ca) and data capture projects to provide data to the public. This includes a staggering 146,000 trees that have been cataloged by type and geo location.
A quick check of the portal shows 2,863 elm trees, with the data downloadable in GeoJSON, CSV, and other formats. The data set is clean, with all values populated except for date_planted and some geo coordinates. Trunk diameter might be used to estimate age. Limitation: Street trees are included, but not park or private trees.
Street trees: Vancouver Open Data Portal
https://opendata.vancouver.ca/explore/dataset/street-trees/
146,000 total trees, 2,863 are genus Ulmus (Elm)
- geometry: {“type”: “Point”, “coordinates”: [-123.148881, 49.256225]}
- tree_id: (5467,91630, … unique integer)
- genus_name: (ULMUS) genus_name=ULMUS is the filter for only elm trees.
- species_name: (Americana,Glabra,Pumila,Carpinifolia)
- common_name: (American Elm, Scots Elm, Siberian Elm, …)
- neighbourhood_name: (SUNSET, KITSILANO, …)
- on_street: (CYPRESS ST,W 18TH AV, …)
- on_street_block: (1800,1900,…)
- diameter: (3,44, …) cm
- date_planted: (2012-03-21, limited to younger trees <20yrs old)
Park trees:
https://vancouver.ca/parks-recreation-culture/trees.aspx
https://vancouver.ca/parks-recreation-culture/parks-gardens-and-beaches.aspx
Stanley Park: Elm is not listed as a major tree species, which is understandable as it is a non-native species to western Canada.
UBC Botanical Garden has 3 lacebark elm trees at their garden. https://collections.botanicalgarden.ubc.ca
I will leave park trees as out of scope for the project because the data is not readily available and the number of trees is small compared to street trees.
Private trees:
This data could possibly be gathered from tree pruning companies, landscaping companies, and nurseries. A quick check of nursery websites shows a focus on smaller decorative or fruit trees, not elms. Vancouver Parks and Recreation holds an annual tree sale to promote tree planting on private land in the city. Elm is not one of the 21 species sold. https://vancouver.ca/parks-recreation-culture/tree-types-new.aspx
I will leave private trees as out of scope for the project because the data is not readily available and the number of trees is likely to be small compared to street trees.
Foursquare: Venue Data
FourSquare has venue data with categories and geo locations for marijuana/cannabis shops, lumberyards, and tree nurseries. Data can be searched by area and retrieved in GeoJSON format. The Foursquare data is crowdsourced, so accuracy is not guaranteed and may have duplicate entries for the same venue and incorrect category assignments.
FourSquare Venue Categories, counts, and categoryIds (within 20km):
- Tree (5 hits. Useless) 52e81612bcbc57f1066b7a24
- Marijuana Dispensary (43) 52c71aaf3cf9994f4e043d17
- Smoke Shop (50 max, 44@4km) 4bf58dd8d48988d123951735 -Smoke shops do not sell cannabis, so they will be excluded.
- Construction & Landscaping (24) 5454144b498ec1f095bff2f2
- Garden Center (43) 4eb1c0253b7b52c0e1adc2e9
- Hardware Store (18) 4bf58dd8d48988d112951735
- Campground (22) 4bf58dd8d48988d1e4941735
- RV Park (0@20km, 2@50km) 52f2ab2ebcbc57f1066b8b53
- Summer Camp (3@20k, 4@50k) 52e81612bcbc57f1066b7a10
Vancouver Neighborhood data:
Geo data manually sourced from Wikipedia and Google maps:
Neighbourhood, Latitude, Longitude
Arbutus-Ridge,49.2575,-1223.174444
Downtown,49.284167,-123.121111
Dunbar-Southlands,49.25,-123.185
Fairview,49.264,-123.13
Grandview-Woodland,49.275,-123.067
Hastings-Sunrise,49.276,-123.039
Kensington-Cedar Cottage,49.248,-123.073
Kerrisdale,49.220,-123.158
Killarney,49.223,-123.039
Kitsilano,49.267,-123.167
Marpole,49.215,-123.114
Mount Pleasant,49.260,-123.108
Oakridge,49.225,-123.117
Renfrew-Collingwood,49.243,-123.047
Riley Park,49.239,-123.103
Shaughnessy,49.245,-123.133
South Cambie,49.246,-123.122
Strathcona,49.279,-123.087
Sunset,49.224,-123.089
Victoria-Fraserview,49.218,-123.066
West End,49.285,-123.134
West Point Grey,49.265,-123.200
Other relevant data (non-geographical):
- Both the UBC Endowment Lands and Stanley Park are outside the official city boundaries.
- Wikipedia shows that Cannabacea (Cannabis) is in fact an outgroup of the Ulmacaea (Elm) family. https://en.wikipedia.org/wiki/Ulmaceae
- Four of the top 5 Cannabis diseases are fungal: https://blueskyorganics.com/growing-science/top-five-cannabis-diseases/
- Dutch Elm disease is also fungal and is still a risk in North America. https://en.wikipedia.org/wiki/Dutch_elm_disease
- Elm trees are also found in other Canadian cities, so the findings for Vancouver could be very useful. Toronto, Montreal, and Quebec who once had large elm populations and still have 1500-5000 trees each. Regina has almost 100,000 elm trees (45% of all trees in the city)!
- Several articles say that dutch elm disease is not present west of Manitoba, and the elms planted in Alberta and BC are outside their natural climate range. Warming temperatures however have impacted forests in western Canada, so these trees may now be at risk.
Personal involvement:
I grew up in rural Ohio where we had a huge elm tree in the backyard that only survived the dutch elm epidemic because there were no other elm nearby. I heard stories as a child how street after street of elm trees turned brown and had to be cut down. Now that I’m in Vancouver downtown, I again have elm trees beside my condo.
Methodology
The project instructions note that this should be the main component of the document, but methodology means the ‘system of methods used’, and this section will be used to describe how we go about completing the goals and will not include the actual data, analysis, or conclusion. They will be covered in the other sections of this document.
Investigate data sources
The first step is to investigate if the data is readily available to meet the project goals. In this case, the tree data is available from the city’s Open Data portal and has the tree genus and species, and geo coordinates that are required. Venue data is also available from Foursquare and can be searched by categories that cover the store types we are investigating. The Foursquare ‘Marijuana Dispensary’ is exactly what we need for the first analysis, and wood product stores can be identified using several other Foursquare categories. If the Foursquare data was inaccurate, Google APIs are a fallback option. Vancouver neighbourhood data is available on wikipedia and neighbourhoods are also included in the tree data.
Details of the data investigation and data sources are in the Data Understanding section of this document.
After initial review of the tree data and venue data, we conclude that there is sufficient data to begin the project. No other data needs to be gathered.
Without the tree data, this project would have not been possible and the recommendation at this stage to the client would be to request the data from the department that manages street trees.
Access data
Initial data access during the investigation phase was via browser to the Vancouver Open Data Portal, Foursquare, and Wikipedia. This was sufficient to identify the fields and gauge the data quality.
The project used Jupyter Python notebooks running on cloud and locally on a MacBook Pro with Anaconda. Repeated cloud timeouts and reset of the Python environments forced a switch to a local environment that did not timeout or rest Python. The final sharing of the notebook will be on GitHub.
Data was accessed using the Jupter notebook with the Python ‘requests’ library to make the web request, and used the pandas,io.json library to parse and flatten the results. A pandas data frame was used to store the data after flattening via the pandas json_normalize function.
The Python ‘request’ library successfully pulled data back from Vancouver Open Data and Foursquare. The same library was later used to call Google Geocode API to do reverse address geo lookups for missing tree coordinates.
Data cost: Vancouver Open Data is free to access and does not require credentials for the volume of data used in this project. Foursquare requires developer credentials and has a limit of 50 venues per search request using the venue search API in the free tier. This was sufficient for the project. Google Geocode API calls and data are free for the level or requests used in this project. A developer credential was created on the free tier to access the Geocode API. In summary, all data for this project was available for free, as were the the cloud hosted GitHub and IBM Watson environment.
Review raw data
Raw output from the web request were in GeoJSON format and were viewed by displaying the raw data in a Jupter notebook output section. The json_normalized data was flattened to a datagram that was reviewed using the df.head function.
The online JSON viewer at CodeBeautify.org was also used to view the data structure returned by Vancouver Open Data, Foursquare, and Google. See https://codebeautify.org/jsonviewer
Two issues were identified when gathering raw data:
- Some trees had no geo data. Fortunately, the tree street address was correct, and Google Geocode API was able to return latitude/longitude based on the street address.
- The Foursquare explore API consistently returned different results based on the search point and search radius. I believe the explore API is returning venues that it considers the user is most likely to ‘check in’ to. Switching to the venue search API and adding intent=browse corrected this issue and returned consistent results.
Clean Data
Data from the sources was clean and required minimal adjustment. Three issues with data were identified and corrected.
- Foursquare ‘construction’ and ‘hardware store’ categories returned some stores/businesses that were not wood related, such as garage door companies and a glass company. These stores were just noted during the plotting based on their name, and not used when discussing the results.
- The Google Geocode API returned the geocode for the centre of the building at an address, which was not the curb latitude longitude. See the notebook for examples. If you zoom in on the plot maps, some of the trees appear to be planted in the centre of a building, not the curb. The geo locations were good enough for this project and alternative were covered in the Jupiter notebook.
- The geo information in all the calls did not flatten into individual latitude and longitude fields. A few lines of Python data frame code was sufficient to extract the data and store it in individual latitude and longitude columns. Also, the order of latitude longitude was not consistent: [latitude,longitude] vs [longitude,latitude], but once identified, it was easily corrected with Python code.
Tabularize, plot, and chart
A Jupyter Python notebook was used for all data manipulation and display:
Pandas Dataframe head(n) was used to view the tabular data and see results of data manipulation.
Matplotlib plot was used to create bar charts of the tree counts near venues.
Folium to plot data against the Vancouver map and allow visual investigation via zooming.
See the ‘VancouverElmTrees-CapstoneProject.ipynb Jupyter notebook for plots and results with comments.
Answer client questions
See the results section for details. All client questions were answerable using the data available and plots/charts clearly show locations of trees near venues.
Provide summary
See Results and Recommendation sections.
Results
All questions from the city were able to be answered using the available data and data analysis packages.
- What is the breakdown of elm trees by neighbourhood?
See the table and chart of trees by neighbourhood. The top four are: SHAUGHNESSY 646, DUNBAR-SOUTHLANDS 468, KERRISDALE 270, and GRANDVIEW-WOODLAND 269
- Where are the larger groups of elm trees in Vancouver?
Using DB SCAN grouping, the largest group of over 800 trees is the Shaughnessy, Fairview, South Cambie cluster.
- Where are the new cannabis dispensaries located?
They are located throughout the city. See tree/venue maps for detail.
- Are any dispensaries located near groups of elm trees?
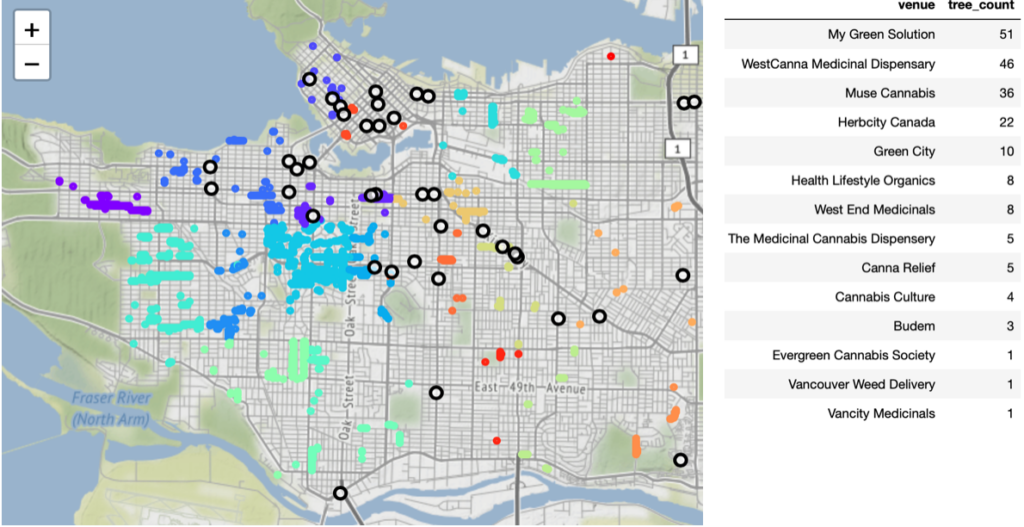
14 of 39 dispensaries have trees within 250 meters. The breakdown near a group of 10 or more trees is: My Green Solution 52, WestCanna Medicinal Dispensary 46, Muse Cannabis 36, Herbcity Canada 22, Green City 10.
- Are any tree nurseries or lumberyards close to elm trees?
Yes, Arbutus Tree Service 62 trees, True Value Hardware 62 trees, Three Home Depots with 56, 11, and 11 trees, and Art Knapp Plantland 15 trees. Two other renovation business have a large number of elm trees nearby: LJH Construction 59 trees, and Ground Level Restoration 20 trees.
- Are any campgrounds or RV parks close to elm trees?
No, the campground and RV Parks are located away from the Vancouver city trees.
- Are the groups isolated in case an infection does start?
The largest groups are not isolated, as seen on the map. Some smaller clusters are isolated, but the largest clusters are close enough that the cluster grouping changes with slightly different DB SCAN hyper-parameters.
- Are there individual outlier trees that could become bridges between groups if infection occurs?
There are approximately 96 outlier (bridge/edge) trees that do not fit into a group. This number changes if different hyper-parameters are used.
Elm Trees in Vancouver (By neighbourhood)

This is a static representation of the Jupiter notebook dynamic map. See the notebook to hover over trees and see neighbourhood, size, type, and tree number. Zoom is also enabled in the notebook to support drill down to areas of interest.

So that is 9 neighbourhoods with over 100 trees each. We have all the elm trees with geo coordinates now, grouped by neighbourhood.
Marijuana Dispensaries

Plot of dispensaries and trees.
There are clearly several dispensaries located closely to clusters of trees.
Charting the dispensaries shows the top 4-5 are near the most trees.
Wood related venues
Next up is the search for the wood related stores. We will use the same process to search and plot, then find the stores nearest to trees.
The categories and ids of interest are documented in the Foursquare developer documents.
Wood related: Construction & Landscaping 5454144b498ec1f095bff2f2 Garden Center 4eb1c0253b7b52c0e1adc2e9 Hardware Store 4bf58dd8d48988d112951735 Outdoor Supply Store 52f2ab2ebcbc57f1066b8b22 Campground 4bf58dd8d48988d1e4941735 RV Park 52f2ab2ebcbc57f1066b8b53 Summer Camp 52e81612bcbc57f1066b7a10
These can be called one at a time, or concatenated together and called all at once.

We see some construction and hardware stores that are not going to carry trees or potentially diseased wood. (Garage doors, metal works, paint, glass.)
Arbutus tree service, True Value Hardware, LJH Construction, Home Depot, Ground Level Restoration, and Art Knapp Plantland are businesses that stand out. A review of each store and diseased wood handling would be appropriate to reduce elm disease risk.

Clustering with DB SCAN
The cluster based on neighborhoods were not ideal, so we will cluster using DB SCAN instead. The results are very dependent on choosing the righ epsilon and min_samples, so plotting results were reviewed until an epsilon=0.2 and min_samples=10 was chosen.

That’s the normalized plot, which gives the flavour of the groupings, but not a geographic view. This shows 27 clusters and a good number of outlier trees.
Now we will take the cluster numbers and assign them to the df_trees ‘cluster’ column that previously used neighbourhood.

Outliers are assigned their own cluster number in DB SCAN, so let’s plot the groups without the outliers first.
The groups like fairly consistent. Now let’s look at just the outliers.

Looking at the plot, there are outer edge trees and then ‘bridge’ trees in between clusters.
The minimum cluster size was set to 10, and there are two near clusters in this plot: one has 9 trees, and another 8 trees. Most of the other outliers are single or groups of 2-4 trees.
DB SCAN Summary
There are 26 groups according to DB-SCAN (using epsilon=0.2 ad min_cluster=10)
The DB-SCAN grouping is nicer than grouping by neighbourhood. The largest group of trees is the Shawnessey/Granville Street group that spans three neighbourhoods. Some of the smaller groups are of individual blocks or small parks with concentrated trees.
Changing epsilon to 0.3 results in a mega group covering the entire centre of the city, and 10 total groups. Epsilon=0.25 results in 18 clusters but the mega group is now smaller in the center but also includes most trees to the west. Epsilon=0.2 and min_cluster=20 results in the entire downtown trees arked as outliers. The settings of epsilon=0.2 and min_trees=10 give 96 outliers and 26 clusters. Epsilon=0.2 and min_cluster=8 reduces this to 76 outliers and 28 clusters. I find the hyper-parameters are difficult to adjust so the clusters look visually ‘correct’.
Venue Summary
14 of 39 marijuana dispensaries have elm trees with 250 meters, and 4 of the dispensaries have 20+ trees within 250 meters.
40 of 122 wood related stores have em trees within 250 meters, and 5 have more than 20 trees nearby. The Foursquare search also pulled categories that are not wood related.
Note: This is a summary of the plots and data analysis from the Jupiter Notebook. For more detail and interactive plots, please use the notebook.
Recommendation
Recommendations:
- Vancouver has an Urban Forest Strategy and tree management service called Tree Vancouver. If dutch elm disease does begin to spread, they are the group that would need to take action.
- Communication with all cannabis dispensaries about disposal of fungal infested products and package is needed. These items should be bagged and not allowed to lay outside were wind could spread spores.
- Communication with wood products stores is also helpful but they likely are already aware of restrictions on diseased wood products. Renovation companies have disposal requirements (double bagged, taped and sealed) for drywall that may contain asbestos and other mold contaminated items. Diseased wood could use the same disposal techniques.
- The largest clusters are close together and cannot be isolated. The smaller clusters are isolated by 10+ blocks and would have a somewhat reduced transmission. There are 96 outlier trees that can be reviewed to determine risk.
- Knowing where the elm trees actually are is a critical first step that has already been completed by the city. If any infection starts, the trees can be monitored and proactively treated with anti-fungals.
Conclusion
The project achieved the goal of answering Vancouver city’s (hypothetical) questions about locations of trees and locations.
The complete code from the Python notebook is available here:
https://aiml.studio/wp-content/uploads/2020/09/VancouverElmTrees-CapstoneProject-KeyHidden.html