Courses completed between January 2020 and March 2020.
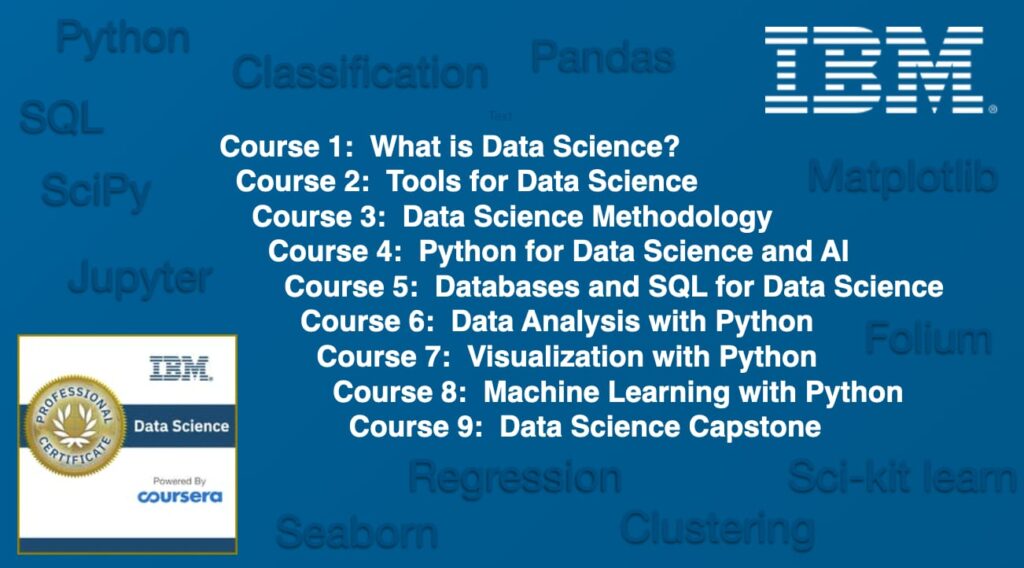
What is Data Science?: The course covered what Data Science is and What Data Scientists Do, and Data Science Topics, and Data Science Business. The course discussed what tools and algorithms data scientists use on a daily basis and what skills are required to be a data scientist. Also further discussed what companies need to do to start with data science and some of the qualities that differentiate data scientists from other professionals.
Tools for Data Science: The course focused on some of the most popular data science tools such as Jupiter Notebooks, RStudio IDE, Apache Zeppelin, and IBM Watson Studio. The course showed why these tools are popular among data scientists and we learned about the user interface and various features of the tools.
Data Science Methodology: The purpose of this course is to share a methodology that can be used within data science to ensure that the data used in problem-solving is relevant and properly manipulated to address the question at hand. We learned the major steps involved in tackling a data science problem: forming a concrete business or research problem, collecting/analyzing data, building a model, and understanding the feedback after the model deployed.
Python for Data Science and AI: The course covered Python Basics, Python Data Structures, Python Programming Fundamentals, Working with Data in Python, and Analyzing US Economic Data and Building a Dashboard.
Databases and SQL for Data Science: This course taught Introduction to Databases and Basic SQL, Advance SQL, Accessing Databases using Python, and hands-on Data Science assignments that work with multiple real-world datasets for the city of Chicago. At the end of the course, we were able to connect the databases using Python and manipulating/analyzing the data using Python.
Data Analysis with Python: The course taught the basics of Python to explore many different types of data and how to prepare data for analysis, perform simple statistical analysis, create meaningful data visualizations, predict future trends from data. As the final assignment, we analyzed and predicted housing prices using attributes or features(square footage, # of bedrooms, # of floors, built year, etc) in King County, USA
Data Visualization with Python: The course taught how to take data and present that data in a form that makes sense to people. Various data visualization libraries in Python were introduced such as Matplotlib, Seaborn, and Folium. As the final assignment, we generated two visualization plots. The first one was a plot to summarize the results of a survey that was conducted to gauge audience interest in different data science topics. The second plot is a Choropleth map of the crime rate in San Francisco.
Machine Learning with Python: This course covered the purpose of Machine Learning and where it applied to the real world and a general overview of Machine Learning topics such as supervised vs unsupervised learning, model evaluation, and Machine Learning algorithms(Regression, Classification, Clustering, Recommender Systems). For the final project, a set of past loan data was provided and expected to analyze and preprocess the dataset before building a classifier to predict whether a loan case will be paid off or not.
Applied Data Science Capstone: This provided a taste of what data scientists go through in real life when working with data. We used Foursquare as location data and location provider to retrieve data venues in different neighborhoods around the world. We utilized Python and the panda library to manipulate data and used the Folium library to display the geospatial data for our results and findings. We produced a separate blog post for this capstone project. Please see the following blogs: IBM Data Science Capstone Project: Vancouver Elms and IBM Data Science Capstone Project: The Battle of the Cities